Graphical example: one explanatory variable
Let’s answer to the example from the previous blog:
We know for the last 5 years how much a company spent in Marketing for a product, and as a consequence, what were the Sales of this product.
What is the prediction of Sales Amount, if we spend 2700€ in Marketing budget?

Graphically, applying linear regression is to draw a line which will minimize each error between this line and the different markers.
A first try hereunder: it’s not bad, but we can definitely do better, and reduce the errors, meaning minimizing globally the red distances between the markers and the line.

With the second try hereunder, we consider it’s the best possible solution we can do graphically, with only small errors for each marker.
Now, with the line drawed, lets’ answer to the initial question What is the prediction of Sales Amount, if we spend 2700€ in Marketing budget?
We mark the abcissa at 2700€ and note the relevant ordinate; the graphical answer a prediction of around 42000 € sales amount next year:

Graphical example: two explanatory variables
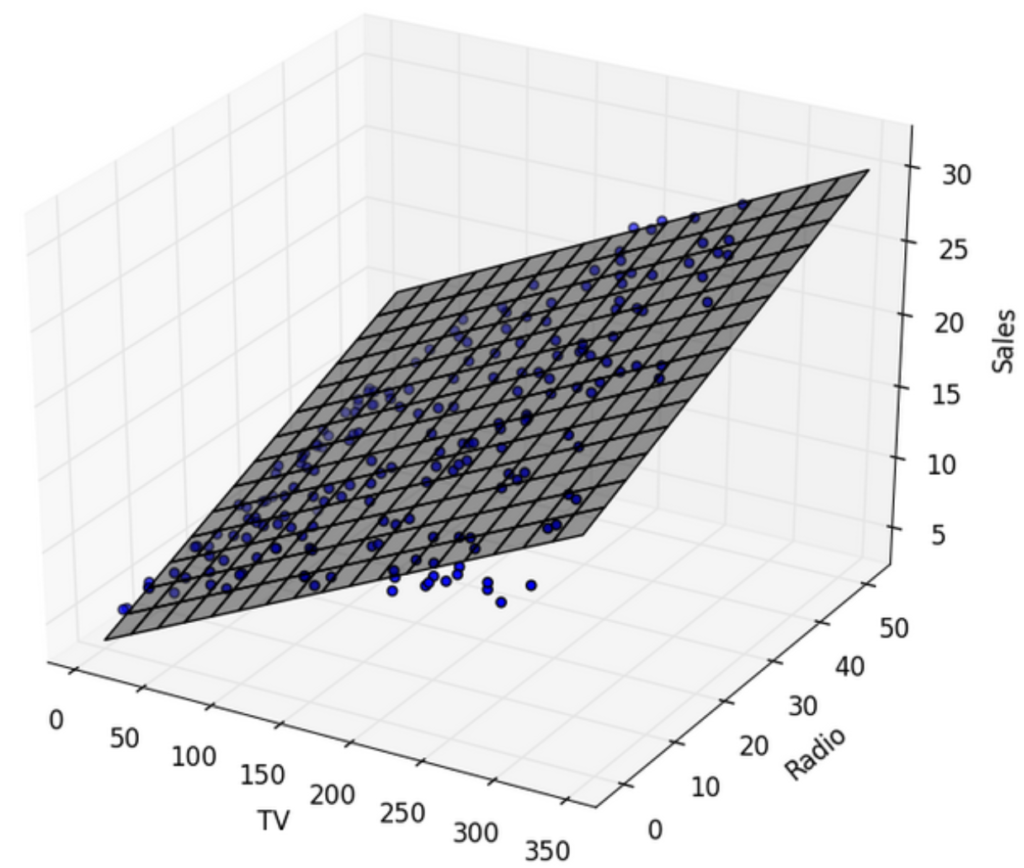
If there are 2 explanatory variable, the aim would be to print the markers in 3D and to draw a plan with less possible distance between each marker and the plan.
An example hereunder: TV budget and Radio budget are the explanatory variables, and Sales is the response variable. the gray plan is minizing all the distances with the markers
Graphical example: three or more explanatory variables
Sorry, there is no way for displaying graphs in 4 dimensions or more.
Mathematical solution for linear regression
With mathematics there is an analytic solution which determines the line which will have the least possible global error, for miniziming the sum of the squared errors
Why the errors are squared?
- it simplifies
the calculation with signs: whatever the error is positive or negative, it
becomes then positive, exactly like a distance - the
mathematic solution is working for a squared error!
Analytic solution means:
– THE perfect solution
– solution ALWAYS found… if existing
Solution description
If you consider a set of observations, each of one with :
- N explanatory
variables called: X1, X2, …, XN - one response
variable Y
Linear regression proposes to approximate the values Y from each observation with the Predicted value Ŷ through N+1 parameters: a0, a1, …, aN, such that
Predicted value Ŷ = a0 + a1*X1 + a2*X2 + … + aN*XN
Linear means the variables X1,X2,…XN can only be multiplied by values, and then only additions/substractions are possible
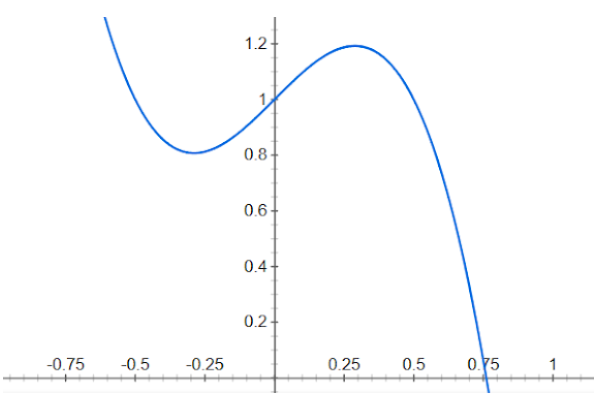
For example: X1 and X2 cannot be multiplied together in a linear model; 1 divided by X1 is not linear; logarithm of X1 is not linear; X1 power 2 is not linear; exponential of X1 is not linear…
Example with Python
Let’s solve the Sales amount problem introduced at the beginning of this post.
As a reminder, the data are:
| Marketing budget € | Sales amount € | |
| Year 1 | 2120 | 19240 |
| Year 2 | 2300 | 28500 |
| Year 3 | 2410 | 32010 |
| Year 4 | 2530 | 37020 |
| Year 5 | 2600 | 40580 |
We want to answer to these questions: What is the prediction of Sales Amount, if we spend 2700€ or 2800€ in Marketing budget?
Hereunder the program code:
# we need this package for dealing
# with data frames, which can be considered as enhanced matrix
import pandas
# we need this package which is doing
# the calculation for linear regression
from sklearn import linear_model


# we create the explanatory variable dataset for training
xtrain = pandas.DataFrame({'Marketing Budget': [2120,2300,2410,2530,2600], }, index = ['year1', 'year2', 'year3', 'year4', 'year5'])
print(xtrain)

# we create the target variable dataset for training
ytrain = pandas.DataFrame({'Sales Amount': [19240,28500,32010,37020,40580],}, index = ['year1', 'year2', 'year3', 'year4', 'year5'])
print(ytrain)

# it's time to calculate the
# we create the explanatory variable dataset for prediction
xtest = pandas.DataFrame({'Sales Amount': [2700,2800],}, index = ['estimation1','estimation2'])
print(xtest)


# Creation of the linear regression object
regr = linear_model.LinearRegression()

# Training of the model using the training sets
regr.fit(xtrain, ytrain)


# Displaying the parameters of the linear model
print('Coefficient: \n', regr.coef_)
print('Intercept: \n', regr.intercept_)

# Make prediction for the testing set
ytest = regr.predict(xtest)
print(ytest)
Let’s show the results in the notebook:

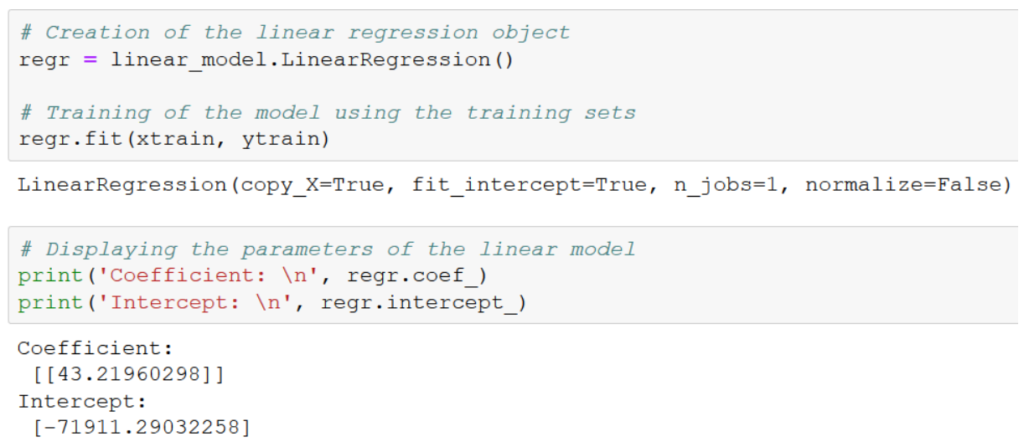
The intercept is negative, -71911€. It means, according to the model, if there is 0 € of marketing budget, the sales are negative. Of course this is impossible to have negative sales.
Remind that the linear regression is based on linear tendency. Between 2200 and 2600 € marketing budget, we have assumed that sales were a linear function of marketing budget. Outside this range, as we don’t have figures, we don’t know.
Always consider data and models with relevance to the business context and the constraints
There is only one coefficient, hence it’s « coefficient1 », 43€.
It means that each euro invested in additional marketing budget is converted into additional sales amount 43€: this is a key figure for business, in order them to decide the next year how much to spend in marketing.
Last words about linear model
The linear model is fast to calculate. Hence, it is usually interesting to run it and to compare its results with other results
Linear regression is relevant only when there is a linear link between explanatory variables and response variable.
Linear regression should NOT be used there for example: